Data Story-Telling: Telling Your Story Through Data Analytics

In this blog post, we are going to introduce you to an example of data story-telling. Data Story-Telling is a methodology to present a story by analyzing data as proof to support your story. The proof of story can be a dashboard, graph, or any visual to easily for judgment.
HYPOTHESIS
Imagine that you are an IT manager. Your team receives tickets, or technical issues, from employees. In May last year, there were two people quitting your team. You have heard complaints from the remaining employees about doing more work.
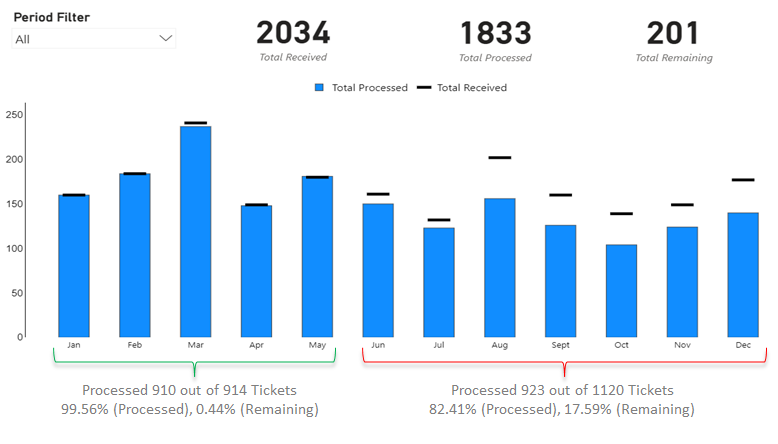
You are wondering if you should hire more people. First, you want to understand what impact the departure of employees has had on your team's overall productivity. You plot the monthly trend of incoming tickets and those processed over the past year. You see that there is some evidence your team's productivity is suffering from being short-staffed and now want to turn the quick-and-dirty visual you created into the basis for your hiring request.
1. Revise your IT-ticket visual to meet the objective in the above-mentioned scenario.
2. Construct your story's target and storyline.
3. Present your result in a storytelling manner.
Dataset
| Ticket Type | Month | Number |
| Received | January | 160 |
| Received | February | 184 |
| Received | March | 241 |
| Received | April | 149 |
| Received | May | 180 |
| Received | June | 161 |
| Received | July | 132 |
| Received | August | 202 |
| Received | September | 160 |
| Received | October | 139 |
| Received | November | 149 |
| Received | December | 177 |
| Processed | January | 160 |
| Processed | February | 184 |
| Processed | March | 237 |
| Processed | April | 148 |
| Processed | May | 181 |
| Processed | June | 150 |
| Processed | July | 123 |
| Processed | August | 156 |
| Processed | September | 126 |
| Processed | October | 104 |
| Processed | November | 124 |
| Processed | December | 140 |
EXPERIMENT
We can do an experiment on the above hypothesis which will describe below:
TARGET
- Audience: IT Director, HR Executive, Board of Directors
- Objective: Request to hire more staff to boost the work productivity
- Evidence: Demonstrate the proof of the monthly trend of received and processed tickets with a chart
STORYLINE
| Step | Outlines |
| Context |
|
| Obstacles (Challenges) |
|
| Struggle (Conflict) |
|
| Resolution |
|
| Lessons / Recommendation Actions |
|
MONTHLY TREND OF RECEIVED & PROCESSED TICKETS
